East Midlands Eakring-Newark

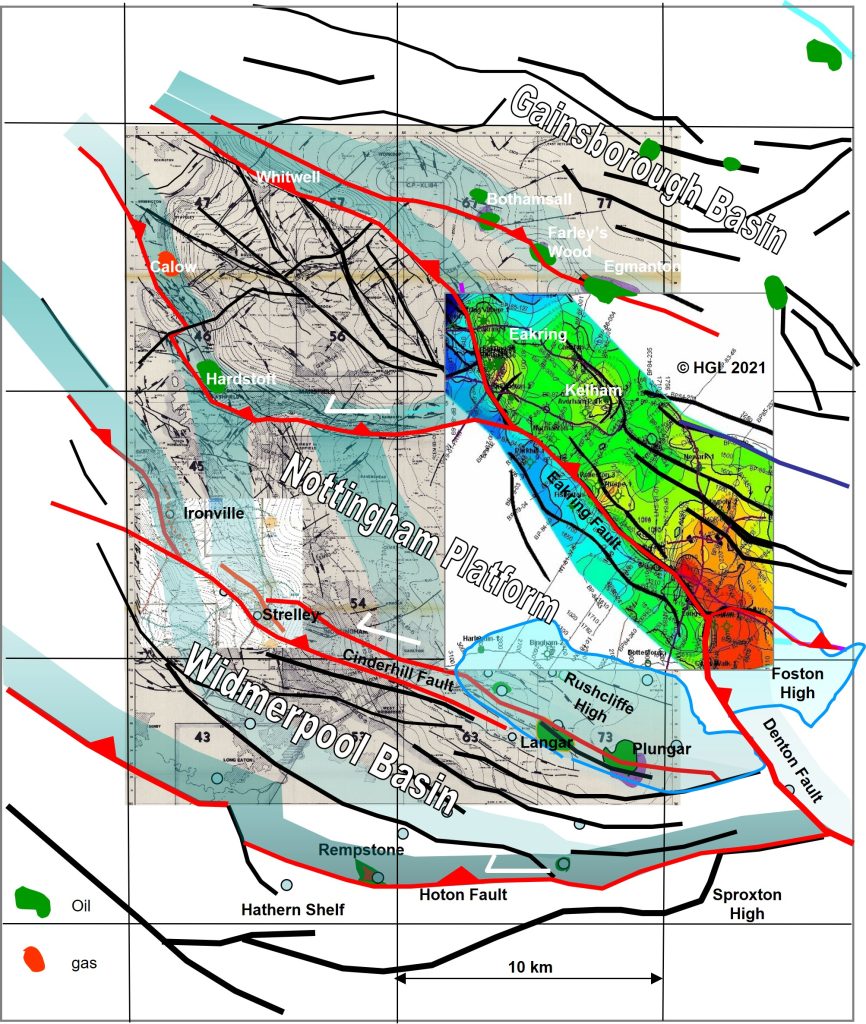
What defines key areas for commercial geothermal drilling in East Midlands? This base map – its the 1984 Coal Measures Top Hard depth compilation of Charterhouse Group, file 40416 on UKOGL- holds our answer: red faults are the prime locations. Those trends are the main Carboniferous growth faults which have undergone the greatest subsequent structural inversion.
In particular it’s the footwalls of those fracture trends which we consider to be particularly prospective for geothermal plays. Why? Because the late Carboniferous NW-SE to westerly shortening across the sub-basins produced strong faulting and footwall collapse in left-handed shear on the extensional growth faults with that trend, such as Eakring, Hoton and Denton.
The colour inset is our own Eakring to Foston two-way time mapping, and the areas highly rated by us in these notes are ones we have studied in detail. The conclusions are entirely ours. The bias in our comments is that we know more about the fracture patterns for those plays, than we do for prospects elsewhere in the northern onshore UK basins.
The definitive stratigraphic summary and regional depth mapping for East Midlands at top EC6 (top Visean), top Namurian and at Top Hard coal levels in depth is BGS’s 2011 Subsurface Memoir “Structure and evolution of the East Midlands region of the Pennine Basin”. The Memoir is indispensable.


